|
|
2 years ago | |
|---|---|---|
| .. | ||
| audit | 2 years ago | |
| README.md | 2 years ago | |
| w2_day1_ex2_q1.png | 2 years ago | |
| w2_day1_ex2_q3.png | 2 years ago | |
README.md
Exercise 2 Linear regression in 1D
The goal of this exercise is to understand how the linear regression works in one dimension. To do so, we will generate a data in one dimension. Using make regression from Scikit-learn, generate a data set with 100 observations:
X, y, coef = make_regression(n_samples=100,
                         n_features=1,
                         n_informative=1,
                         noise=10,
                         coef=True,
                         random_state=0,
                         bias=100.0)
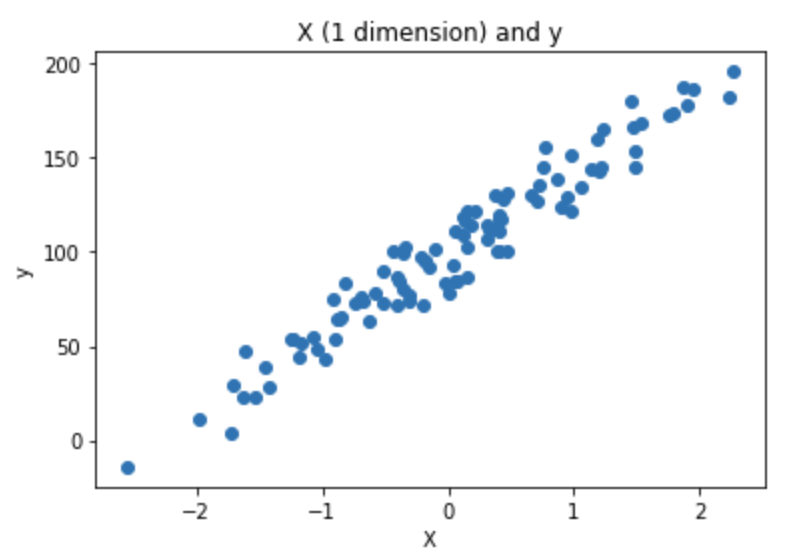
- Plot the data using matplotlib. The plot should look like this:
-
Fit a LinearRegression from Scikit-learn on the generated data and give the equation of the fitted line. The expected output is:
y = coef * x + intercept -
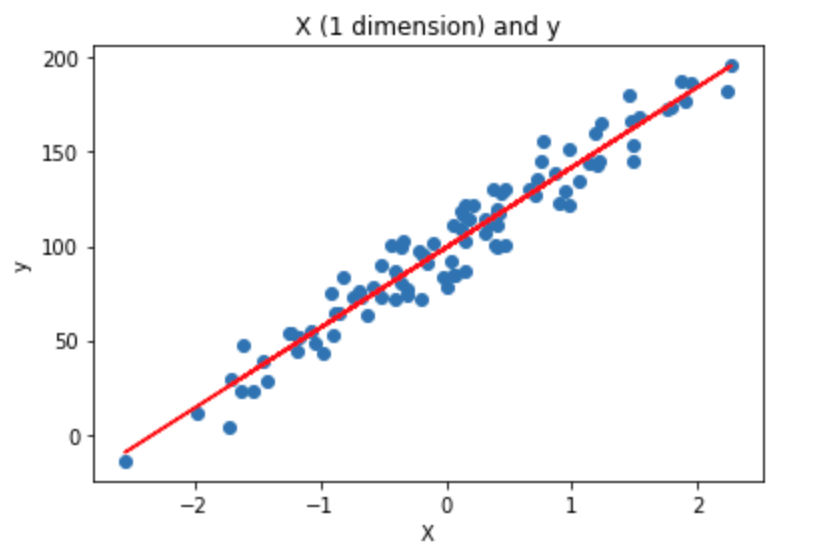
Add the fitted line to the plot. the plot should look like this:
-
Predict on X
-
Create a function that computes the Mean Squared Error (MSE) and compute the MSE on the data set. The MSE is frequently used as well as other regression metrics that will be studied later this week.
def compute_mse(y_true, y_pred):
    #TODO
    return mse
Change the noise parameter of make_regression to 50
- Repeat question 2, 4 and compute the MSE on the new data.
https://scikit-learn.org/stable/modules/generated/sklearn.metrics.mean_squared_error.html

