mirror of https://github.com/01-edu/Branch-AI.git
You can not select more than 25 topics
Topics must start with a letter or number, can include dashes ('-') and can be up to 35 characters long.
1.2 KiB
1.2 KiB
Exercise 6 Plotly 1
Plotly has evolved a lot in the previous years. It is important to always check the documentation.
Plotly comes with a high level interface: Plotly Express. It helps building some complex plots easily. The lesson won't detail the complex examples. Plotly express is quite interesting while using Pandas Dataframes because there are some built-in functions that leverage Pandas Dataframes.
The plot outputed by Plotly is interactive and can also be dynamic.
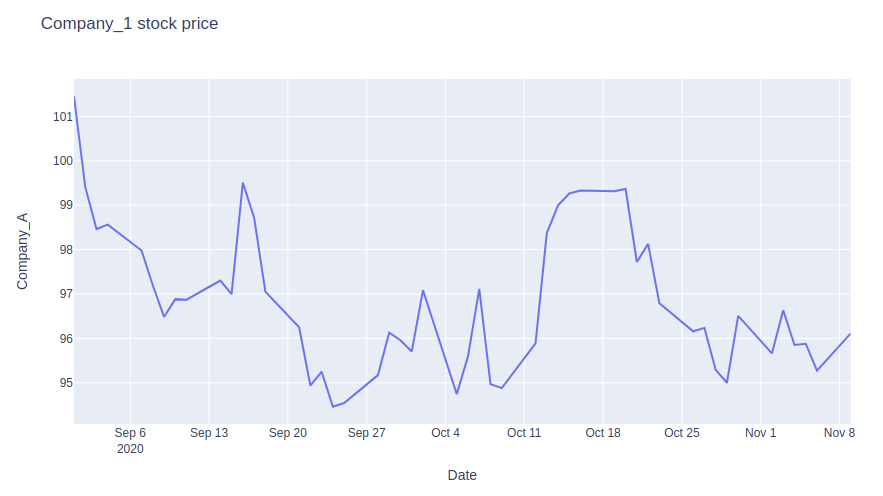
The goal of the exercise is to plot the price of a company. Its price is generated below.
returns = np.random.randn(50)
price = 100 + np.cumsum(returns)

dates = pd.date_range(start='2020-09-01', periods=50, freq='B')
df = pd.DataFrame(zip(dates, price),
                  columns=['Date','Company_A'])
- Using Plotly express, reproduce the plot in the image. As the data is generated randomly I do not expect you to reproduce the same line.
The plot has to contain:
- title
- x-axis name
- yaxis name
- Same question but now using
plotly.graph_objects. You may need to useinit_notebook_modefromplotly.offline.
