mirror of https://github.com/01-edu/Branch-AI.git
You can not select more than 25 topics
Topics must start with a letter or number, can include dashes ('-') and can be up to 35 characters long.
592 B
592 B
Exercise 4 Matplotlib 2
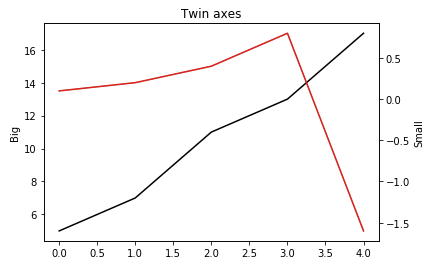
The goal of this plot is to learn to use Matplotlib to plot different lines in the same plot on different axis using twinx. This very useful to compare variables in different ranges.
Here is the data:
left_data = [5, 7, 11, 13, 17]
right_data = [0.1, 0.2, 0.4, 0.8, -1.6]
x_axis = [0.0, 1.0, 2.0, 3.0, 4.0]
- Reproduce this plot
The plot has to contain:
- the title
- name on left y-axis and right y-axis
- style:
- left data in black
- right data in red
