mirror of https://github.com/01-edu/Branch-AI.git
You can not select more than 25 topics
Topics must start with a letter or number, can include dashes ('-') and can be up to 35 characters long.
|
|
2 years ago | |
|---|---|---|
| .. | ||
| audit | 2 years ago | |
| README.md | 2 years ago | |
| w1day03_ex3_plot1.png | 2 years ago | |
README.md
Exercise 3 Matplotlib 1
The goal of this plot is to learn to use Matplotlib to plot data. As you know, Matplotlib is the underlying library used by Pandas. It provides more options to plot custom visualizations. Howerver, most of the plots we will create with Matplotlib can be reproduced with Pandas' .plot().
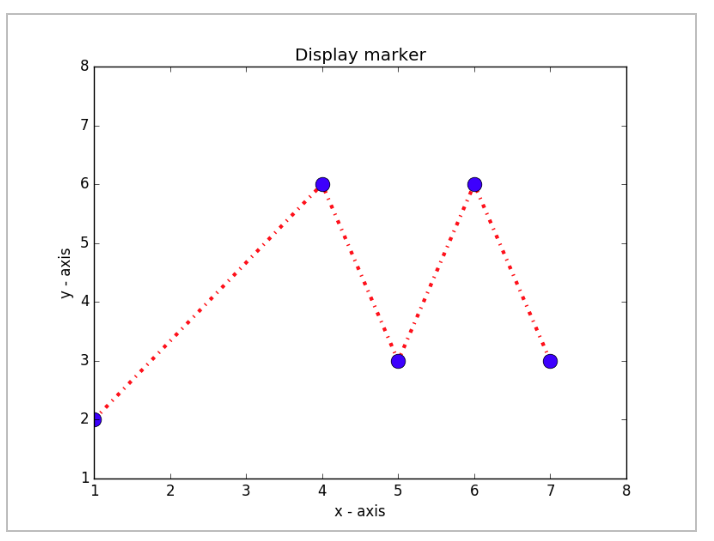
- Reproduce this plot. We assume the data points have integers coordinates.
The plot has to contain:
- the title
- name on x-axis and y-axis
- x-axis and y-axis are limited to [1,8]
- style:
- red dashdot line with a width of 3
- blue circles with a size of 12
